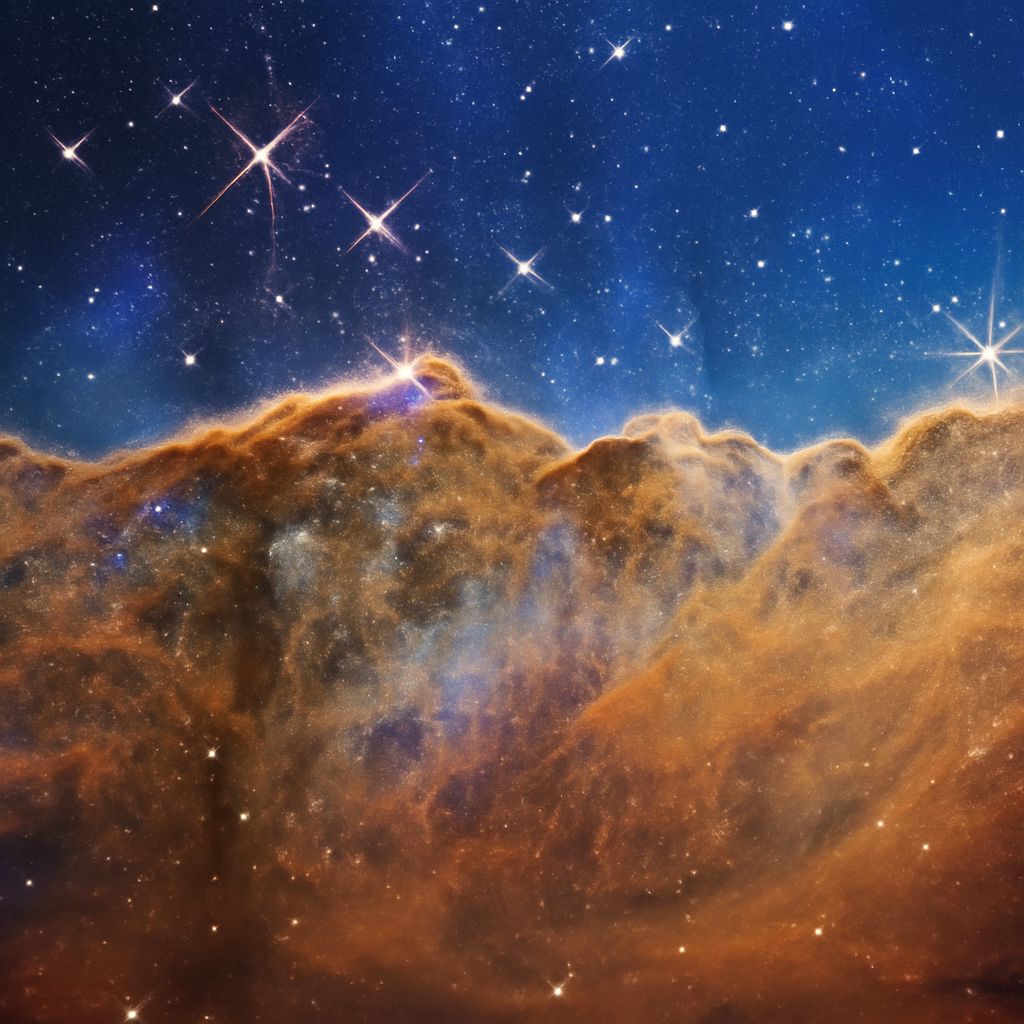
In an image of the Cosmic Cliffs, enlarged views reveal red jets and outflows among the clouds. Its color is part of a key, not a direct record of what an eye would see. Reading a photograph of space begins with finding out what the instrument measured and how those measurements became a visible image.
Start with the specific image
NASA’s Carina Nebula Jets page identifies this view as an observation by the James Webb Space Telescope’s Near-Infrared Camera, or NIRCam. The region lies at the edge of a gaseous cavity in NGC 3324, about 7,600 light-years away. NASA describes the image as separating selected wavelengths from the Cosmic Cliffs observations to highlight outflows associated with young stars.
The telescope is a joint NASA, European Space Agency, and Canadian Space Agency mission. The image page credits those agencies and the Space Telescope Science Institute, and names the science and image-processing contributors. That information gives the reader a trail from a circulating picture back to the observation and its interpretation. A similar-looking space photograph of the same region may combine different filters or even different instruments, so its colors need their own key.
Read the color key
NIRCam measures near-infrared light, wavelengths longer than those visible to human eyes. In this version of the image, NASA assigns blue to data from the F187N filter at 1.87 microns, green to F444W at 4.44 microns, and red to F470N at 4.7 microns. A micron is one millionth of a meter. Each filter selects a range of wavelengths around the stated value; the colors make those separate measurements visible together.
The result is a composite: data from multiple filtered observations are combined into one displayed image. It is a form of space photography built from measurements and processing choices. Blue in the finished picture identifies the assigned contribution of the 1.87-micron data; it does not mean an observer beside the cloud would see blue light in that place. NASA notes that the selected wavelengths help highlight molecular hydrogen and outflows. Color alone, however, should not be treated as a complete chemical analysis of every pixel.
In astronomical photographs, this translation can reveal structure that would be difficult to see at visible wavelengths. It also makes choices about which data to include, how brightly to display them, and how to combine them. Comparing another photograph of space without reading its filter key can make a change in color look like a change in the object.
Orient the view and understand its scale
The companion annotated image from ESA/Webb includes north and east arrows and a scale bar. On a sky image, north need not point toward the top of the page. The arrows indicate celestial directions as seen on the sky; their relationship differs from a ground map viewed from above. Use them to compare the same region across images instead of assuming that matching corners show matching directions.
The bar represents two light-years, the distance light travels in two years. NASA lists the main image as roughly 7.3 arcminutes across, corresponding to about 16 light-years at the stated distance. An arcminute describes an angle on the sky, while a light-year describes distance. The estimated physical extent depends on the distance to the region; the two measurements answer different questions.
The inset views call attention to particular areas with active outflows. Their placement helps locate those details in the larger scene, but a flat image does not directly provide the depth or motion of every feature. Those interpretations draw on additional observations and analysis. Even the bright points have to be read with the caption: objects that appear close together in the frame need not be close together in space.
A quick reading checklist
When encountering space photography, keep four questions nearby:
- Which mission and instrument made this particular image, and where is the original release?
- Which wavelengths or filters contributed, and what visible color represents each one?
- Is the image a composite, and do the arrows, scale bar, or field of view explain its orientation and size?
- What does the caption support, and which claims would require additional measurements?
Use those answers to distinguish an image of space from an unprocessed view through human eyes, while still appreciating the structures the data reveal.